Let me guess: You've got a dozen dashboards. Salesforce reports. HubSpot analytics. Product usage metrics. A custom dashboard your engineer built last quarter. Maybe even a spreadsheet you update every Monday morning.
And yet, you still can't answer basic questions like "Why did that deal stall?" or "Which leads should we prioritize this week?"
Welcome to 2026, where most B2B SaaS founders are dashboard-rich and insight-poor.
The Dashboard Fatigue Epidemic
Here's what's happening: Your team has become professional data tourists. They click through colorful charts, nod at trend lines, and then… go back to their gut instincts anyway.

The problem isn't that your dashboards are wrong. They're probably accurate. The problem is they're passive. They tell you what happened, but they don't tell you what to do about it. And they definitely don't do anything automatically.
Think about your last revenue review meeting. How much time did you spend arguing about data definitions versus actually making decisions? How many times did someone say "I need to pull that into a spreadsheet" before you could move forward?
That's dashboard fatigue. And it's killing your velocity.
The reality is that traditional dashboards were built for a different era. They answered "What happened last quarter?" when what you actually need to know is "What should we do right now, and is it working?"
Reporting vs. Orchestration: The Fundamental Shift
Let's draw a clear line here. Reporting shows you the scoreboard. Orchestration plays the game.
Reporting: Your marketing dashboard shows 500 MQLs came in last month. Great. Now what? Someone still needs to score them, route them, and follow up manually.
Orchestration: When a high-value lead hits your website, visits pricing three times, and matches your ICP, your system automatically assigns them to your best AE, triggers a personalized sequence, and alerts your SDR: without anyone clicking a button.
See the difference? One requires constant human interpretation and action. The other runs your revenue engine automatically.
The organizations winning in 2026 aren't the ones with the prettiest dashboards. They're the ones where data flows trigger actions, where systems talk to each other, and where insights automatically become workflows.
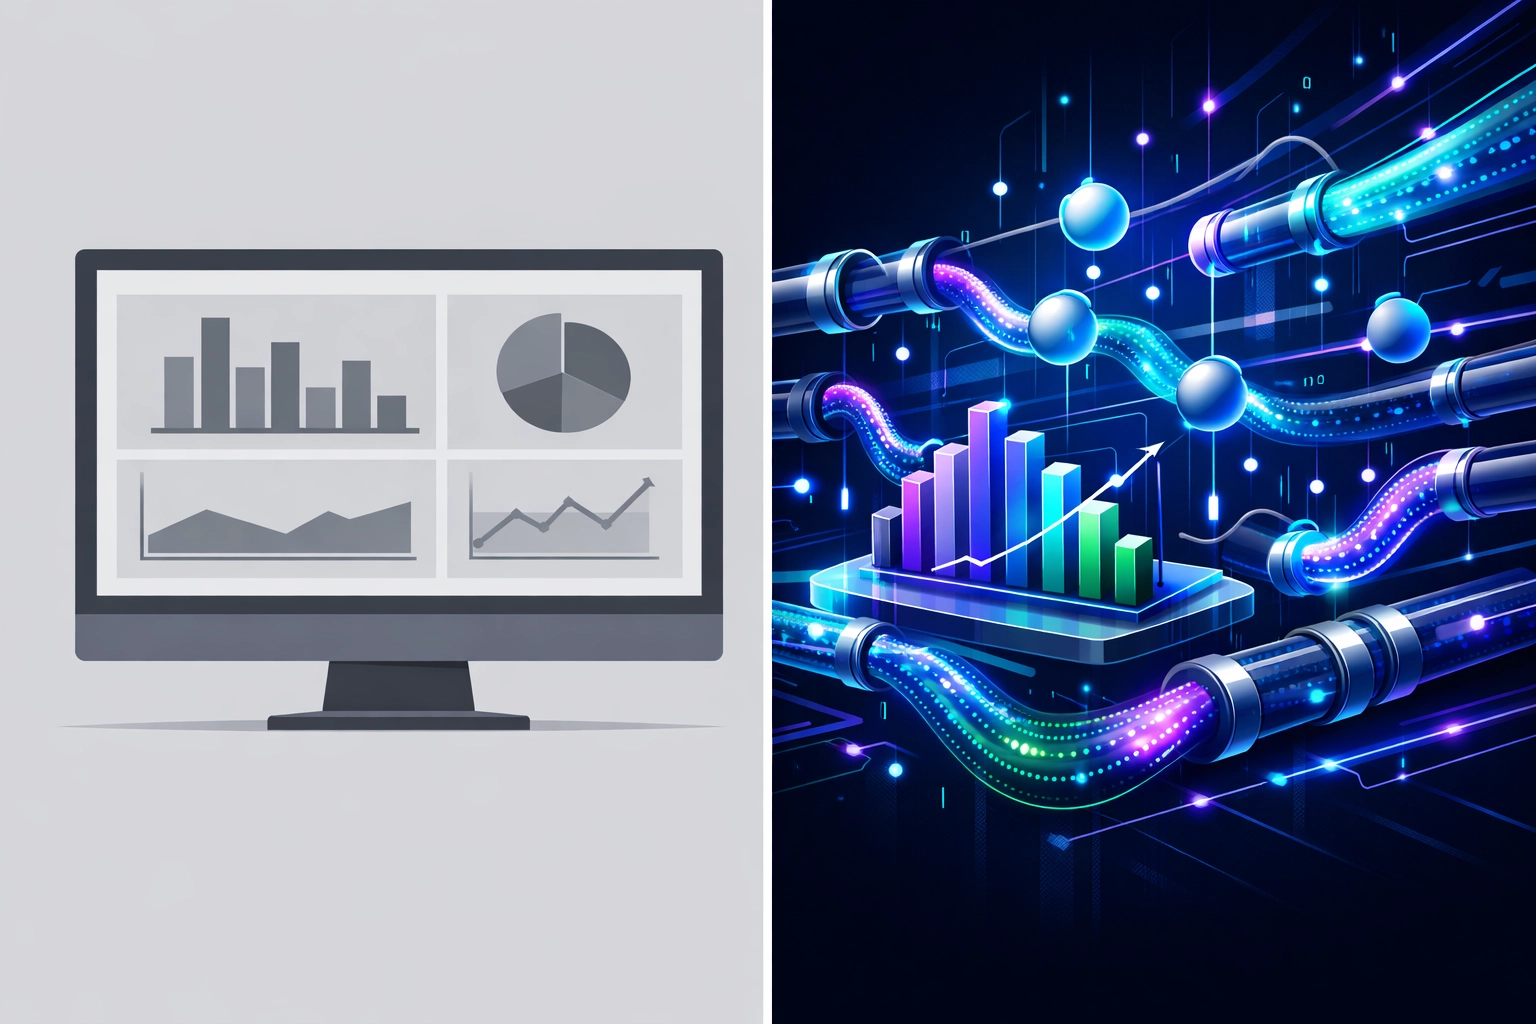
This is what we mean when we talk about data orchestration. It's moving from "here's what the data says" to "here's what the data is doing." Your RevOps stack should function less like a library and more like a command center.
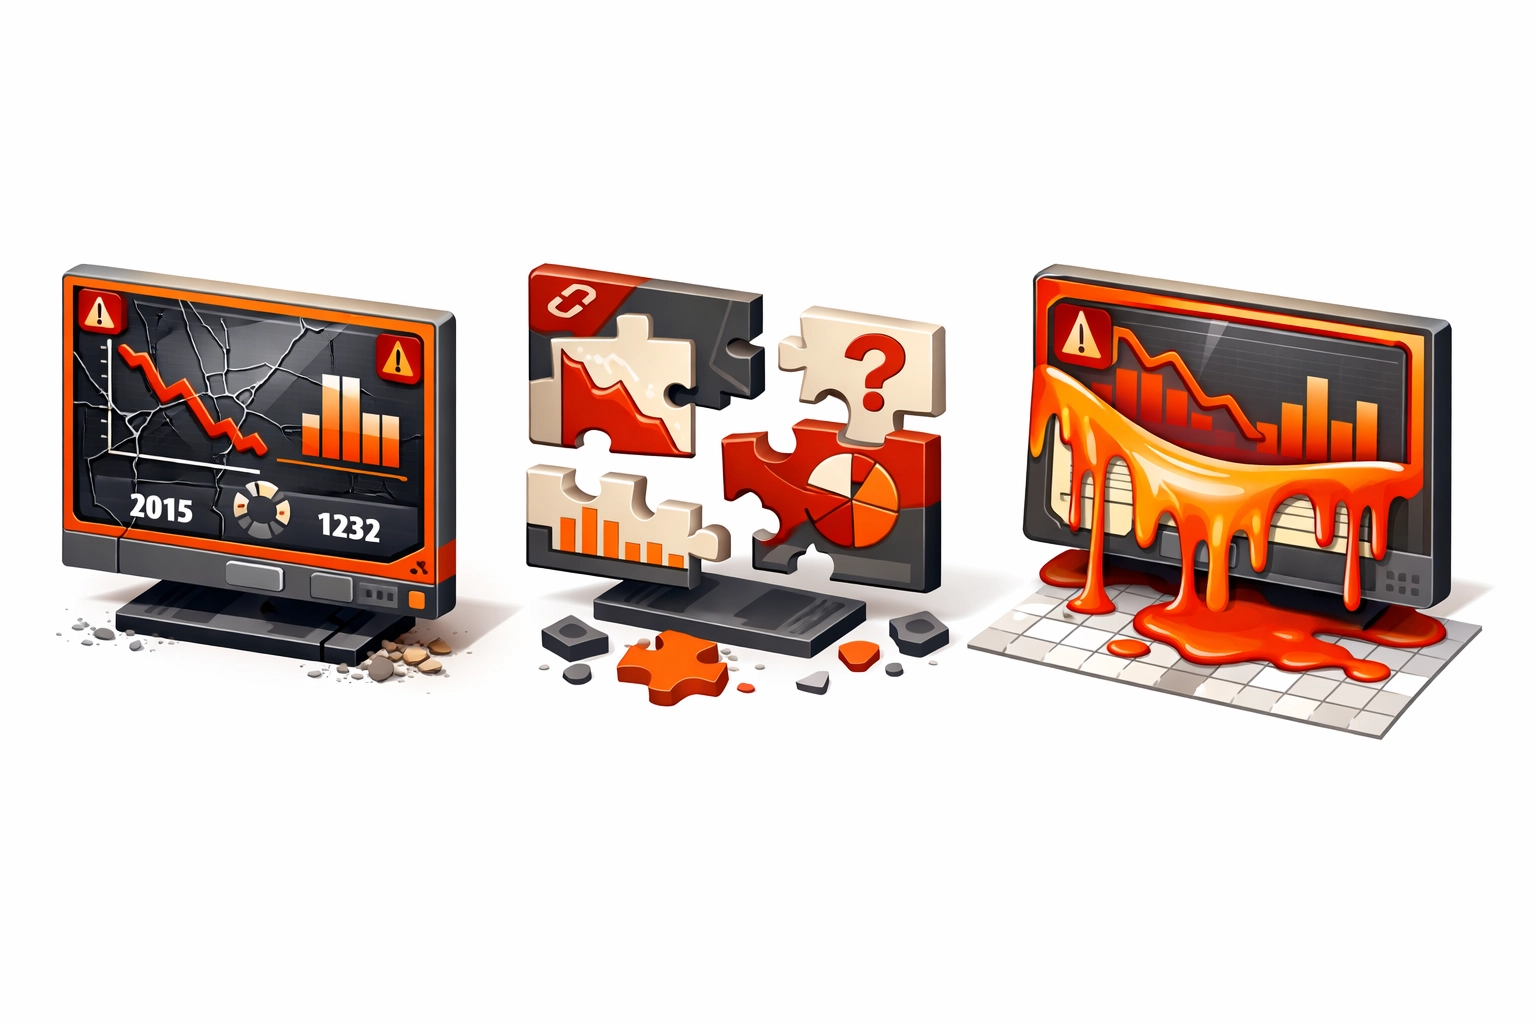
The 3 Signs Your Dashboards Have Rotted
Here's how to know if you're suffering from dashboard rot:
Sign #1: The Stale Data Death Spiral
Your dashboards still show metrics from systems you've partially migrated away from. Data syncs break, and no one notices for weeks because everyone's looking at different versions of truth. Your VP of Sales is making decisions based on numbers that are three days old: which in SaaS velocity terms might as well be ancient history.
Clean data foundations drive a 40% increase in sales efficiency and a 22% drop in deal slippage. But that only happens when your orchestration layer automatically flags and fixes data quality issues in real-time, not when someone remembers to run a cleanup script.
Sign #2: Context-Free Numbers
Your dashboard shows a 15% drop in demo-to-close rates. Is that good or bad? Compared to what? Which segment? What changed?
Static dashboards show you the "what" but strip away the "why" and "so what." You end up spending more time investigating the dashboard than actually solving the problem it revealed. Meanwhile, your competitor's orchestrated system already flagged the issue, identified it's specific to enterprise deals, and automatically adjusted territory assignments.
Sign #3: The Monday Morning Spreadsheet Ritual
If your team is exporting dashboard data into spreadsheets to "really analyze it," your dashboards aren't working. This is the clearest signal that your reporting infrastructure has become a bottleneck rather than an accelerator.
The spreadsheet ritual means you're manually doing what should be automated. You're the orchestration layer. That's not scalable, and it's definitely not how you want to spend your strategic capacity.
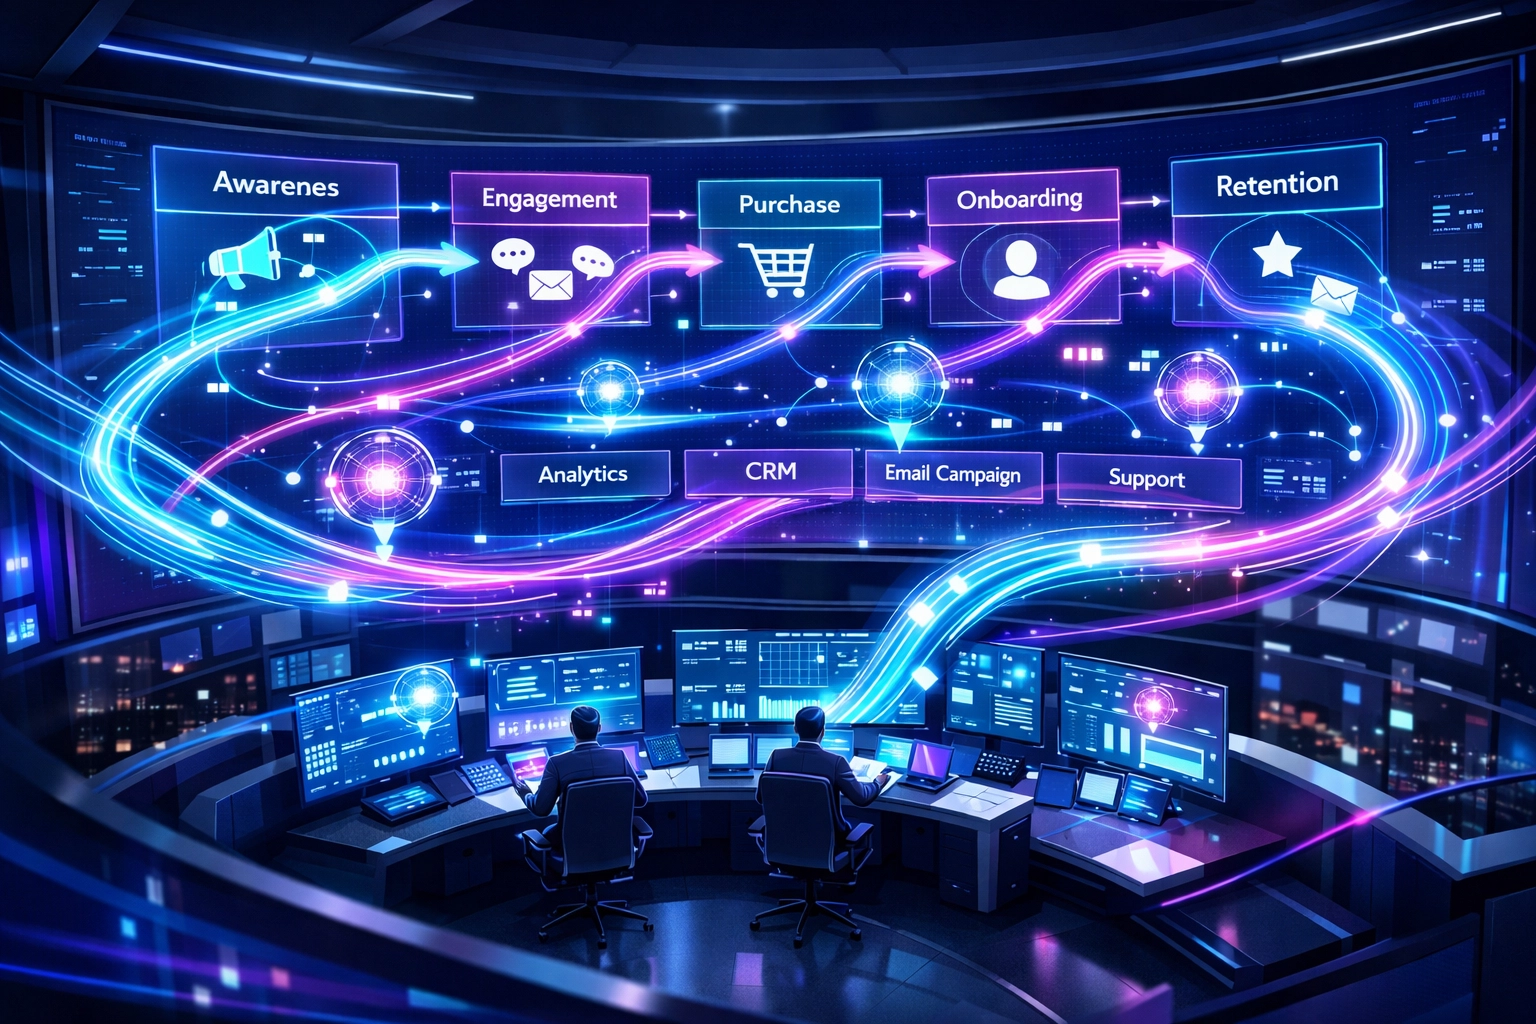
Building Your Revenue Command Center
So what does the alternative look like? Think of it as upgrading from a weather report to an air traffic control system.
A Revenue Command Center doesn't just show you metrics. It gives you a unified view across the entire customer journey and automatically takes action based on what it sees.
Here's what changes:
Lead routing happens instantly based on real-time signals. Not just firmographic data, but behavioral patterns, intent signals, and engagement velocity. Your system knows that a prospect who visited your API docs and pricing page in the same session should route differently than someone who just downloaded a whitepaper.
Handoffs become seamless. When a deal moves from SDR to AE, or from Sales to Customer Success, all the context flows automatically. No more "let me catch you up" meetings. No more critical information lost in Slack messages.
Forecasting moves from guesswork to predictive intelligence. Instead of asking reps to update opportunity stages manually, your orchestration layer analyzes historical patterns, current engagement, and deal complexity to surface real risk and opportunity.
This is what modern b2b saas growth consulting and revops consulting is really about: building systems that operate automatically, not just systems that require constant human analysis.
The First Step: From Static Reports to Dynamic Engines
Look, you don't have to rebuild your entire stack tomorrow. But you can start thinking differently about what you're building.
Here's where to begin:
Audit your manual work. Track what your team does after looking at dashboards. Every time someone exports to Excel, manually sends a notification, or "keeps an eye on" something: that's an orchestration opportunity.
Pick one workflow to automate. Start with something painful and frequent. Maybe it's lead assignment. Maybe it's deal slippage alerts. Choose one thing where the gap between "seeing the data" and "taking action" is costing you real money.
Connect systems, don't just integrate them. Integration means your tools can talk. Orchestration means they actually have a conversation. Your marketing automation should trigger sales sequences. Your product usage data should inform customer success outreach. Your support tickets should influence renewal forecasting.
Measure orchestration, not just outcomes. Start tracking how fast data flows through your system. How long does it take from lead capture to first touch? From demo to proposal? From upgrade signal to expansion conversation? These velocity metrics tell you if your orchestration is working.
The companies building effective saas go-to-market strategy in 2026 are treating RevOps like product development. They're not asking "What reports do we need?" They're asking "What should our revenue engine do automatically?"
Your Dashboards Aren't Dead: They're Just Not Enough
Here's the truth: You still need visibility. You still need metrics. Good dashboards matter.
But they're table stakes now, not a competitive advantage.
The advantage comes from what happens after the dashboard loads. Does it sit there waiting for someone to interpret it? Or does it trigger your revenue engine to respond?
Most B2B SaaS founders between $1M-$25M ARR are at an inflection point. Your dashboards got you here. They showed you what was working when you were smaller. But orchestration is what scales.
The question isn't whether your dashboards are dead. It's whether you're ready to bring your revenue operations to life.
And if you're not sure where to start, that's exactly what we help founders figure out. Because the best time to build orchestration into your revenue engine was yesterday. The second best time is right now.
Need help moving from dashboard fatigue to revenue orchestration? Let's talk about building a system that actually drives growth, not just reports on it.

